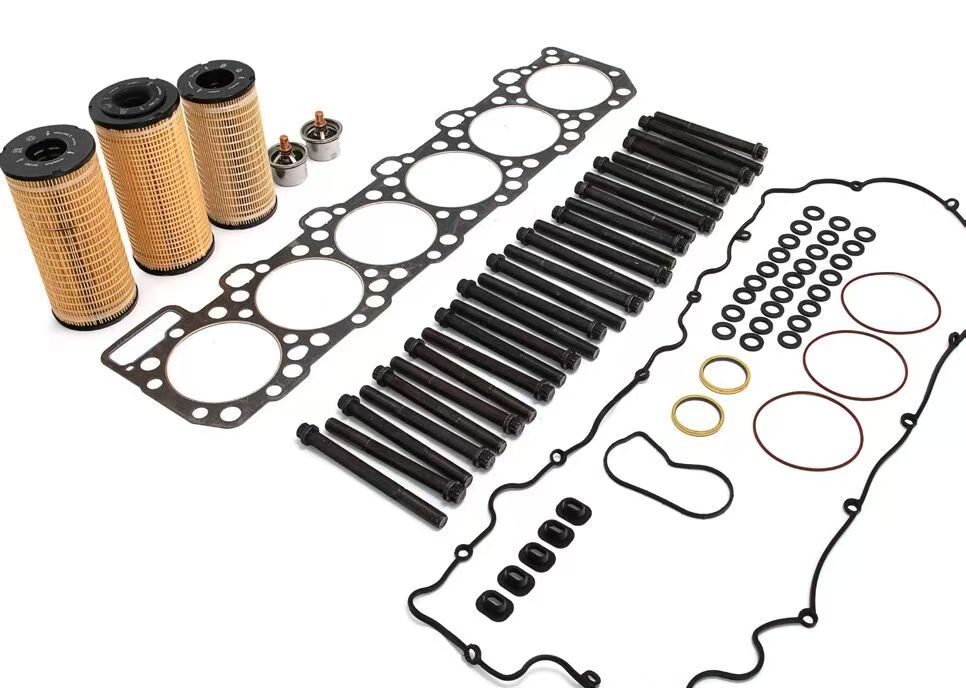
Diesel engines power the global industrial economy—running ships, trains, generators, construction equipment, and critical backup power systems. Financially, a diesel engine is not just machinery; it is a high-value capital asset. Its Total Cost of Ownership (TCO) is defined not by purchase price, but by how well you manage its maintenance lifecycle.

1. Introduction: Maintenance Is a Strategic Investment
Many businesses view maintenance as an unavoidable cost. In reality, it is one of the most impactful investments you can make.
Over an engine’s lifetime, maintenance-related expenses typically account for 25% to 40% of total operating costs. Poor maintenance doubles long-term expenses, destroys uptime, and severely reduces resale value.
This article provides a clear financial framework for finance leaders, fleet managers, investors, and asset owners. It helps you shift from reactive emergency spending to lifecycle value optimization—so every dollar you spend extends profitable operation.
2. Highest-Cost Maintenance Components
Routine tasks are frequent but low-cost. The largest financial risks come from four critical systems:
- Fuel Injection System
Extremely sensitive to fuel quality and contamination. Repairs make up 25%–35% of major overhaul costs and directly determine fuel efficiency.
- Turbocharger
Operates under extreme heat and stress. Failure often damages the engine core.
- Cylinder Liners & Pistons
Wear directly causes power loss, high blow-by, and increased fuel consumption.
- Crankshaft & Bearings
Represent catastrophic financial risk. Failure usually results in a full engine write-off.
3. Financial Triggers for Planned Overhaul
The goal is to overhaul at the ideal time—maximizing run time while avoiding expensive failures. Watch these key indicators:
- Oil Analysis Trends
Rising wear metals (Fe, Cr, Cu) or fuel/coolant contamination signal accelerated damage.
- Crankcase Blow-by
High pressure indicates worn piston rings or liners.
- Specific Fuel Consumption (SFC)
A 3%–5% increase means overhaul will pay for itself through fuel savings.
- EGT Margin
Declining exhaust gas temperature margin shows performance decay and upcoming core repair.
4. Consumables: Small Costs That Prevent Huge Losses
Consumables are inexpensive individually but critical to long-term financial health.
- They represent 10%–15% of annual maintenance spending.
- Move from fixed-interval replacement to condition-based replacement
Using pressure-drop sensors for air filters can extend service life by 20%.
- Financial Reality:
High-quality OEM filters and fluids protect $50,000–$200,000 core systems. Cheap aftermarket parts create false savings and lead to catastrophic failures.
5. Standard Major Overhaul Cost Breakdown
- Parts & Materials: 60%–70%
Largest share; core components, high-precision parts, and high-temperature alloys.
- Skilled Labor: 20%–25%
Teardown, inspection, machining, and assembly.
- Component Reconditioning: 10%
Crankshaft grinding, cylinder head resurfacing, blade restoration.
- Logistics & Miscellaneous: 5%
Transportation, storage, and specialty lubricants.
6. Key Financial Metrics You Must Track
- Direct Maintenance Cost (DMC) – $ per Operating Hour
The single most important KPI in engine asset management.
- Mean Time Between Overhaul (MTBO)
Actual life vs. theoretical life.
- Cost of Unscheduled Downtime (CUD)
CUD = (Lost Revenue per Hour + Emergency Premium) × Downtime Hours
- Return on Maintenance Investment (ROMI)
Measures fuel savings, extended life, and avoided failures versus maintenance cost.
7. Top Causes of Unplanned Maintenance
Ranked by frequency and financial damage:
- Cooling System Failure (≈40% of sudden failures)
The most overlooked system; causes overheating, cracked parts, and piston scuffing.
- Fuel Contamination
Water, dirt, and debris destroy injectors and high-pressure pumps.
- Operator Error
Overloading, improper warm-up/cooldown, and excessive idling.
- Neglected Small Leaks
A $5 seal can lead to $50,000+ in seizure damage.
8. Major Factors That Affect Cost & Uptime
- Duty Cycle
Stable, constant-speed operation (generators) → much longer intervals
Variable load, frequent starts → higher wear and cost
- Environment
Heat, dust, and corrosive conditions increase costs by 10%–30%.
- Maintenance Scope
Minimal repair → low upfront cost, short uptime
Performance overhaul → best lifecycle value
Full overhaul → highest cost, longest intervals
- Parts Availability
Logistics delays can double effective maintenance cost due to downtime.
9. Protecting Asset Value
For owners, lessors, and financiers:
- Complete Service Records
Increase resale value by 15%–25%.
- Condition Monitoring
Reduces repair costs by 30%–50% and eliminates unplanned downtime.
- Root Cause Analysis (RCA)
Fix the source, not just the symptom, to avoid repeat expenses.
- LLP Life Tracking
Directly determines residual value and future financial liabilities.
10. Lifecycle Cost Trends & Replacement Economics
Engines follow a classic bathtub curve:
- Early Life: Low cost, high reliability
- Mature Life: Stable, predictable maintenance
- End Life: Rapidly rising repair costs
Financial Replacement Rule:
When a major overhaul costs 60%–70% of a new, more efficient engine, replacement is the smarter financial decision.
11. Conclusion
Diesel engine maintenance is not just a technical task—it is a core driver of profitability, cash flow, and asset performance. By using data-driven financial triggers, optimizing consumable usage, choosing the right overhaul scope, and tracking industry-standard metrics, you can turn your engine fleet from an unpredictable cost center into a stable, high-value asset. Strategic maintenance is not an expense. It is an investment.